目次。
この文章を読んで、面白い!役に立った!...と思った分だけ、投げ銭していただけると嬉しいです。
【宣伝】ギターも歌も下手だけど、弾き語りをやっているので、よければ聴いてください。

はじめに。
株式自動売買プログラムの開発をサボりまくっていたので、久しぶりに少しだけ進めてみた。株式自動売買プログラム開発関連の文章は、以下のカテゴリーにまとめているので、他に興味のある方はどうぞ。
以前、短期と長期移動平均線のペアを使って、株式の買い・売りのタイミングを判断するプログラムを書いた。この移動平均線を使った手法は、初歩的、かつ一般的に使われているものだと思う。
その後、お金を使わない状態で売買デモをして、プログラムがちゃんと動くか、移動平均線を使った手法は如何ほどか、について調べていた。そして、折角なので、プログラムの出力結果をTwitterに垂れ流していた。
2019年の結果はこちら。。。
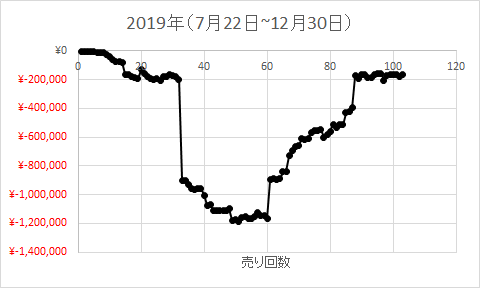
最初は、5日と25日の移動平均線ペアを使っていたが、ひたすら損失。損失。損失。さすがに見ていられなくなったので、移動平均線ペアを5日と25日から19日と26日に変えると、利益が出るようになった(グラフの横軸の40~60のタイミングに変えたと思う)。
ちなみに19日と26日のペアは、以下のグラフを元に適当に決めた。このグラフは、「(正規化)最終損益。」でやったことを325通りの移動平均線ペアでやってみた結果をまとめたものである。
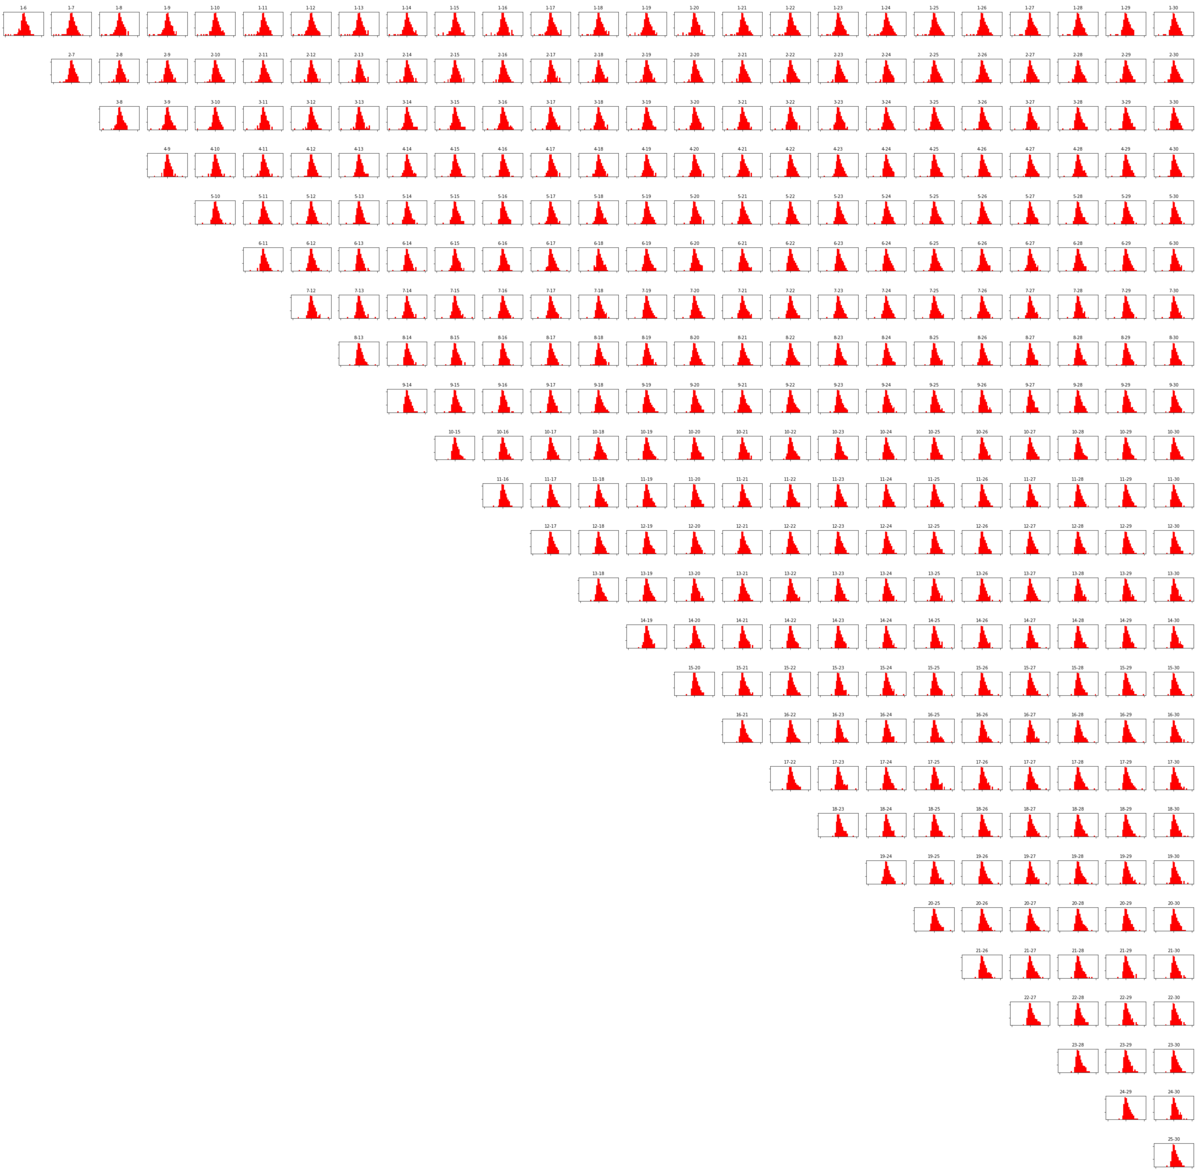
先ほどの2019年のグラフを見ると、移動平均線ペアを19日と26日に変えることによって、利益が出たように見える。
しかし、ここで不安な点がいくつか…。
利益が出たのは、単に日経平均株価が上がっていたから?
7月22日から売買デモを始めたが、その時の日経平均株価は下落していた。そして移動平均線ペアを19日・26日に変えたタイミングで、下落から一転、上昇に転じた。
移動平均線の日数を大きくするほど、長期のトレンドを掴みやすい。移動平均線ペアの日数を5日・25日から19日・26日に変えたことによって、日経平均株価の上昇に合わせて、利益が出るようになったのだと思う。
しかしながら、日経平均株価がずっと下落しているときにこの方法を使えば、逆に損失が膨らむと思う。市場全体の株価が下がり気味でも利益がしっかり出るようなアルゴリズムを考えないといけない。
また、19日・26日は、先ほどのグラフから目視で適当に選んだ数字である。プログラムを組んで、きちんとデータを解析できるのだから、もうちょっとちゃんと移動平均線ペアを決めていきたい。

株式の保有期間が長すぎる。
5日・25日の移動平均線ペアを使っていた時の平均株式保有期間は、22日。19日・26日の場合、その期間は、62日。
一応、僕は、スイングトレードを前提としたプログラムを開発している。スイングトレードは、株式を買って売るまでの期間が数日のトレードのことである。しかし、19日・26日の移動平均線ペアを使うと、2か月以上も株式を保有し続けなければいけない。
これは、株式の中長期投資である。スイングトレードではない。

移動平均線のペアを変えて色々調べてみると…。
使ったのは、約4000社の上場企業の5年分の株価データ(日足。5年に満たない銘柄もある)。データの取得方法は、以下の文章で詳しく説明した。
よくあるのは、Yahoo!をはじめとするWebサイトから株価をスクレイピングする方法。上の文章で説明しているのは、この方法とは違う。僕が紹介したのは、証券会社のサーバーから取ってきたhtmlファイルに埋め込まれているJavaScriptがブラウザ上で行うhttp通信(XMLHttpRequest, XHR)を監視して、サーバー上の生データの在処を突き止める方法。
それはさておき。本題へ。
5年間・1銘柄あたりの平均利益率。
n日・m日の短期・長期移動平均線のペアを使って、5年間、株式売買を行うと、利益率がどのくらいになるか調べてみた。
利益率の定義は、こんな感じ。
結果は、こんな感じ。
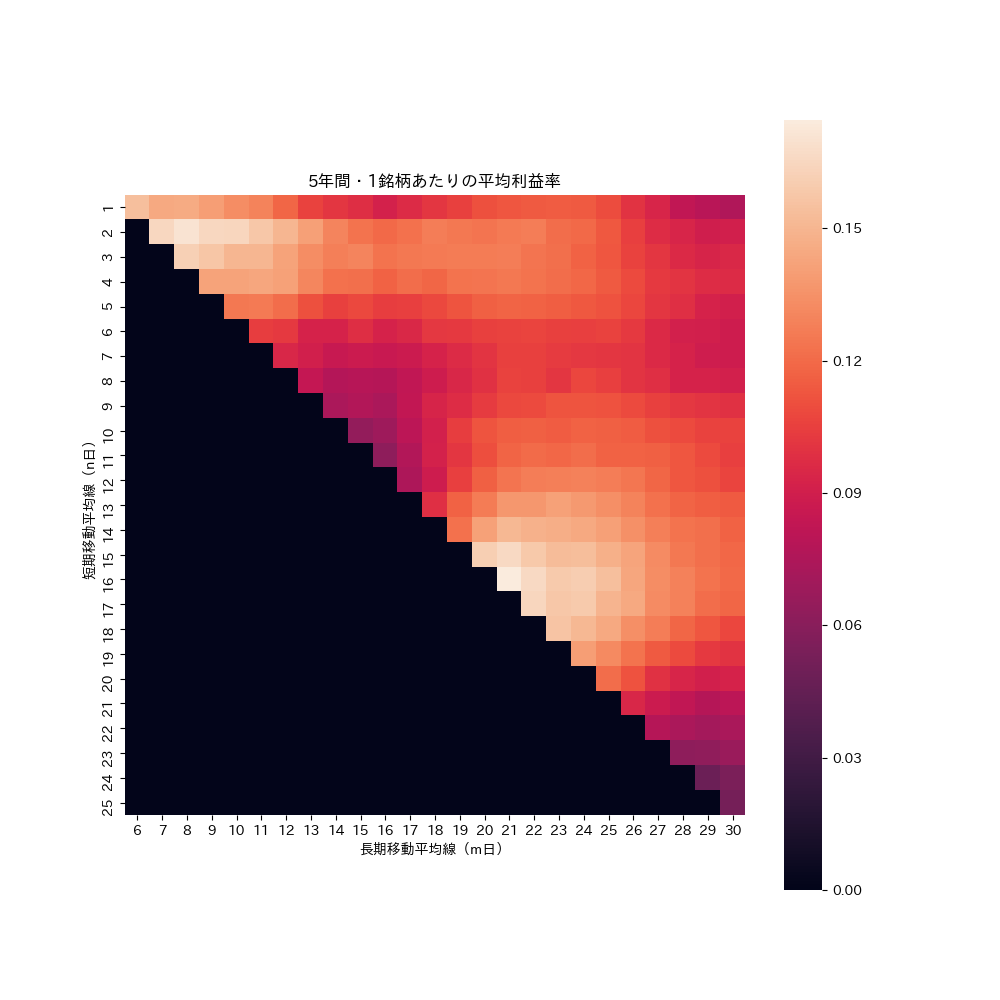
短期・長期移動平均線のペアは、1日~5日・6日~20日、もしくは13日~19日・20日~28日がいいことが分かる。

1銘柄あたりの平均株式保有日数。
結果は、こんな感じ。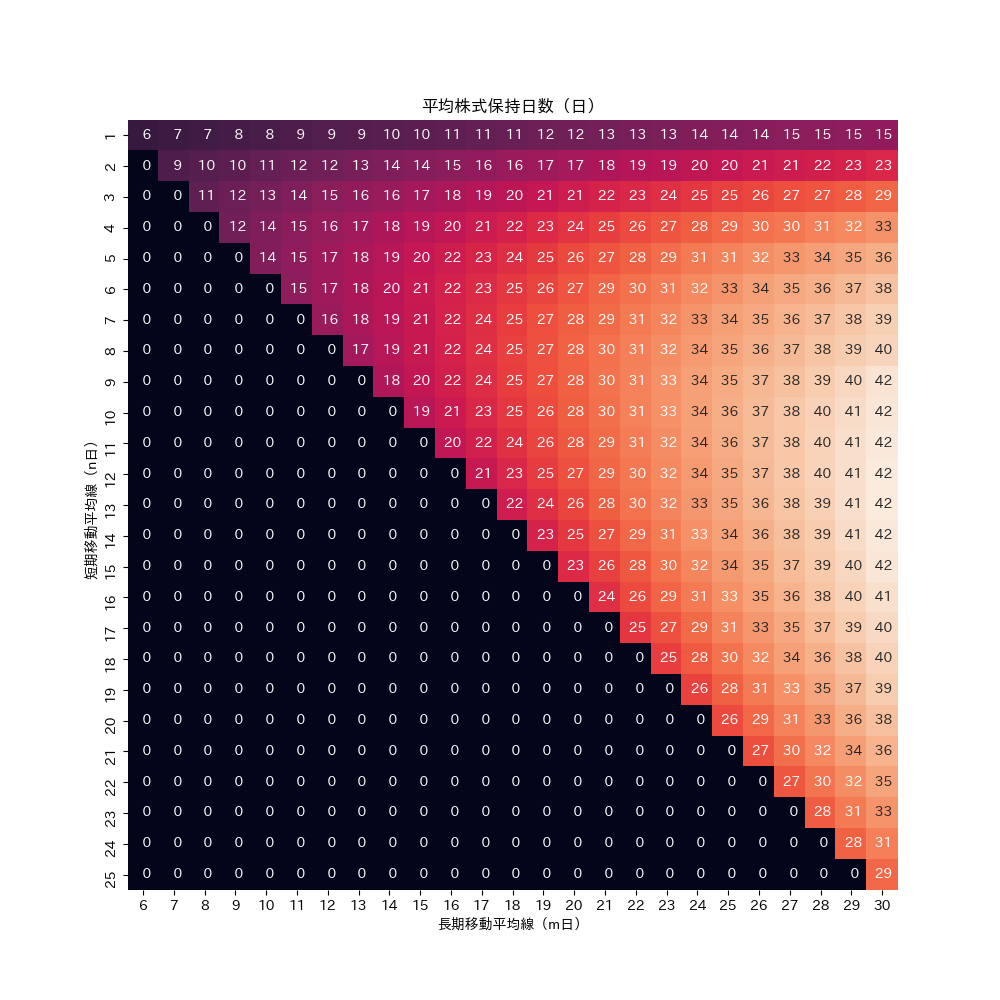
予想通り、nの値が小さくなる程、平均株式保有日数は小さくなる。つまり、nの値が小さくなる程、スイングトレードに適している。予想外だったのは、nの値が中途半端でmの値が大きい方が、n、mともに大きい時よりも保有日数が長くなるということ。
5年間・1銘柄あたりの平均取引回数。
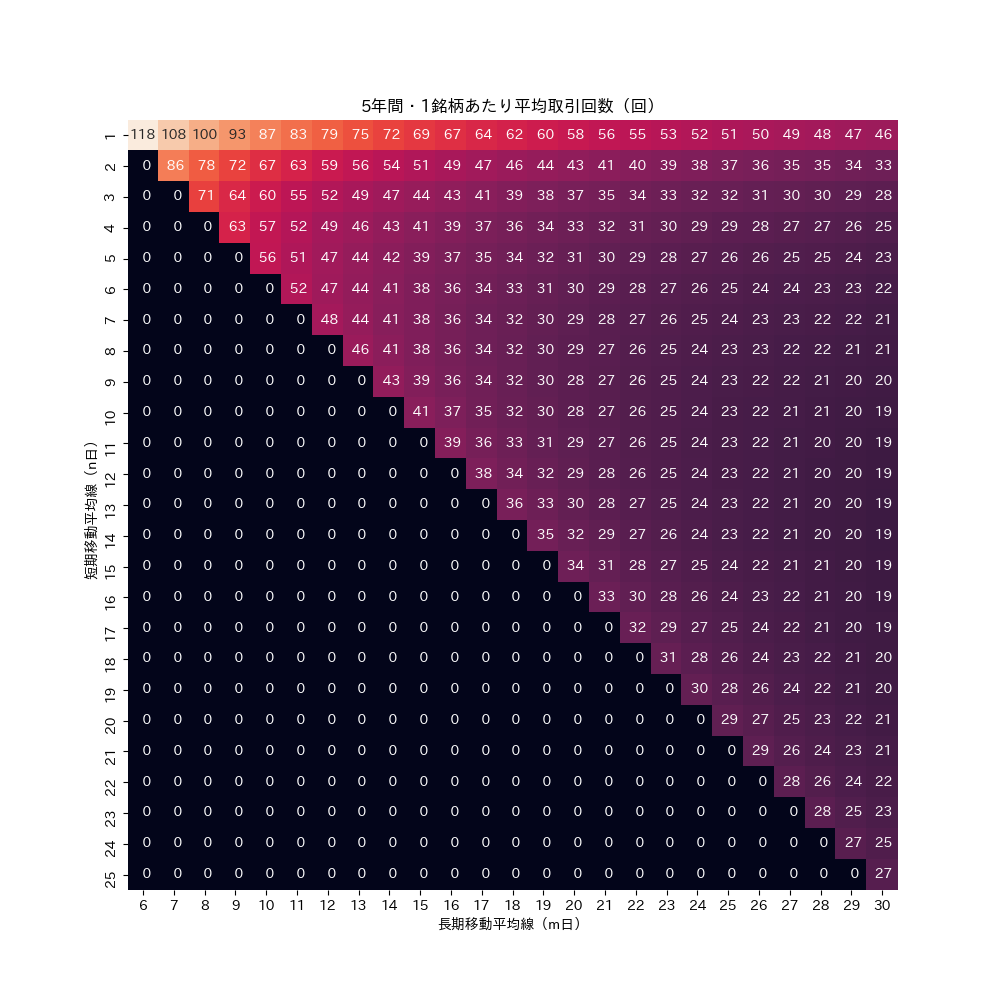
これも予想通り、nの値が小さくなる程、平均取引回数は大きくなる。しかし、平均取引回数がnに関する単調関数ではない点が先ほどと同様に予想外。
ソースコード(プログラムのコード)。
まずは、こちらを参照のこと。
上記の文章内で紹介したソースコードの中のevaluateという関数をちょこっといじったので以下に新たなコードを載せておく。
@jit
def evaluate(buy_or_sell_array, stock_data_portion):
    np_buy_or_sell_array = buy_or_sell_array.values
    np_stock_data_portion = stock_data_portion[['close']].values
    np_profit_loss = np.zeros(len(np_buy_or_sell_array))
    possess_flag = False
    purchase_price = 0
    tmp_date = datetime.date(year=2010, month=1, day=1)

    #result[0] 与えられた期間中の買値で規格化した最終損益。
    #result[1] 株の平均保有期間。
    #result[2] 売買回数。
    result = [0.0, 0, 0]
    for i in range(len(np_buy_or_sell_array)):
        if np_stock_data_portion[i] == 0:
            continue

        if possess_flag == False and np_buy_or_sell_array[i] == 1:
            possess_flag = True
            purchase_price = np_stock_data_portion[i]
            np_profit_loss[i] = -purchase_price
            date_1 = str(buy_or_sell_array.index[i])
            tmp_date = datetime.date(year=int(date_1[0:4]), month=int(date_1[4:6]), day=int(date_1[6:8]))

        if possess_flag == True and (np_buy_or_sell_array[i] == -1 or np_stock_data_portion[i] < 0.90*purchase_price):
            possess_flag = False
            result[0] += ((np_stock_data_portion[i]-purchase_price)/purchase_price)[0]
            np_profit_loss[i] = np_stock_data_portion[i]
            date_1 = str(buy_or_sell_array.index[i])
            result[1] += (datetime.date(year=int(date_1[0:4]), month=int(date_1[4:6]), day=int(date_1[6:8])) - tmp_date).days
            result[2] += 1
    if result[2] == 0:
        result[1] = float('inf')
    else:
        result[1] = result[1]/result[2]
    profit_loss =  pd.DataFrame(np_profit_loss, index=buy_or_sell_array.index)

    return profit_loss, result
そして、今回の解析に用いたソースコードは、以下の通り。
import XXXXX #関数evaluateとかが入っているpyファイル。
import glob
import datetime
import re
import numpy as np
import seaborn as sns
import pandas as pd
import matplotlib.pyplot as plt


storage_uri = 'YYYYY'
gl = glob.glob(storage_uri+'outputs\\stock_price_data\\day\\*.csv')


for short in range(1, 26):
    for long in range(short+5, 31):
        for f in gl[:]:
            temp = f.replace(storage_uri+'outputs\\stock_price_data\\day\\', '')
            temp = re.sub('-.*', '', temp) + ',' + str(short) + ',' + str(long) + ','
            print(temp)
            if '-.csv' in f:
                continue
            stock_data = XXXXX.prepare_data(f)
            print(stock_data[-1:]['volume'])
            nDMAL_1 = XXXXX.calc_nDayMovingAverageLine(stock_data, short)
            nDMAL_2 = XXXXX.calc_nDayMovingAverageLine(stock_data, long)
            buy_or_sell_array = XXXXX.find_intersections(XXXXX.compare_nDayMovingAverageLines(nDMAL_1, nDMAL_2))
            date_1 = str(buy_or_sell_array.index[0])
            evaluation, result = XXXXX.evaluate(buy_or_sell_array, stock_data)
            temp += str(result[0]) + ',' + str(result[1]) + ',' + str(result[2])
            print(result[0])
            print(result[1])
            print(result[2])
            with open(storage_uri + 'outputs\\profit_holdingPeriod_numberBuyingSelling.txt', mode='a') as file_1:
                print(temp, file=file_1)

profit_holdingPeriod_numberBuyingSelling = None
with open(storage_uri + 'outputs\\profit_holdingPeriod_numberBuyingSelling.txt',encoding="utf-8_sig") as f:
        profit_holdingPeriod_numberBuyingSelling = [s.replace('\n','').split(',') for s in f.readlines()]

profit_holdingPeriod_numberBuyingSelling_2 = np.zeros((25, 25))
profit_holdingPeriod_numberBuyingSelling_3 = np.zeros((25, 25))
profit_holdingPeriod_numberBuyingSelling_4 = np.zeros((25, 25))
profit_holdingPeriod_numberBuyingSelling_div = np.triu(np.ones((25, 25)).T, k=1).T

for phn in profit_holdingPeriod_numberBuyingSelling[:]:
    print(phn, flush=True)
    if phn[-1] == '0':
        continue
    profit_holdingPeriod_numberBuyingSelling_2[int(phn[1])-1,int(phn[2])-6] += float(phn[3])
    profit_holdingPeriod_numberBuyingSelling_3[int(phn[1])-1,int(phn[2])-6] += float(phn[4])
    profit_holdingPeriod_numberBuyingSelling_4[int(phn[1])-1,int(phn[2])-6] += float(phn[5])
    profit_holdingPeriod_numberBuyingSelling_div[int(phn[1])-1,int(phn[2])-6] += 1

for i in range(25):
    for j in range(25):
        profit_holdingPeriod_numberBuyingSelling_2[i,j] = profit_holdingPeriod_numberBuyingSelling_2[i,j]/profit_holdingPeriod_numberBuyingSelling_div[i, j]
        profit_holdingPeriod_numberBuyingSelling_3[i,j] = profit_holdingPeriod_numberBuyingSelling_3[i,j]/profit_holdingPeriod_numberBuyingSelling_div[i, j]
        profit_holdingPeriod_numberBuyingSelling_4[i,j] = profit_holdingPeriod_numberBuyingSelling_4[i,j]/profit_holdingPeriod_numberBuyingSelling_div[i, j]

np.save(storage_uri + 'outputs\\profit.npy', profit_holdingPeriod_numberBuyingSelling_2)
np.save(storage_uri + 'outputs\\holdingPeriod.npy', profit_holdingPeriod_numberBuyingSelling_3)
np.save(storage_uri + 'outputs\\numberBuyingSelling.npy', profit_holdingPeriod_numberBuyingSelling_4)


plt.figure(figsize=(10, 10))
tmp = pd.DataFrame(data=np.load(storage_uri + 'outputs\\profit.npy'), index=[i for i in range(1, 26)], columns=[i for i in range(6, 31)])
sns.heatmap(tmp, square=True)
plt.xlabel('長期移動平均線(m日)')
plt.ylabel('短期移動平均線(n日)')
plt.title('5年間・1銘柄あたりの平均利益率')
plt.savefig('5年間・1銘柄あたりの平均利益率')

plt.figure(figsize=(10, 10))
tmp = pd.DataFrame(data=np.load(storage_uri + 'outputs\\holdingPeriod.npy'), index=[i for i in range(1, 26)], columns=[i for i in range(6, 31)])
sns.heatmap(tmp, square=True, annot=True, fmt="3.0f", cbar=False)
plt.xlabel('長期移動平均線(m日)')
plt.ylabel('短期移動平均線(n日)')
plt.title('平均株式保持日数(日)')
plt.savefig('平均株式保持日数(日)')

plt.figure(figsize=(10, 10))
tmp = pd.DataFrame(data=np.load(storage_uri + 'outputs\\numberBuyingSelling.npy'), index=[i for i in range(1, 26)], columns=[i for i in range(6, 31)])
sns.heatmap(tmp, square=True, annot=True, fmt="3.0f", cbar=False)
plt.xlabel('長期移動平均線(m日)')
plt.ylabel('短期移動平均線(n日)')
plt.title('5年間・1銘柄あたり平均取引回数(回)')
plt.savefig('5年間・1銘柄あたり平均取引回数(回)')
最後に。
割と予想通りの結果になった。けれども、大事なのは定量的な結果が得られたということ。短期移動平均線の日数を短くすれば、株式の保有期間が減り、取引回数が増えるということは、定性的にはもちろん分かるが、「どのくらい日数を減らしたら、どのくらい保有期間が短くなって、どのくらい取引回数が多くなるか」っていうのは、ちゃんと調べないことには分からない。
こういった数値データがあると、
「元本が〇〇万円あって、〇〇種類の銘柄をターゲットにしていて、株式保有日数が平均〇〇日になるようなスイングトレードをやりたいからn日とm日の移動平均線を使おう!」
といった感じで適切に戦略を立てることができる。
この文章を読んで、面白い!役に立った!...と思った分だけ、投げ銭していただけると嬉しいです。